Addition chart
Addition Chart 0–10
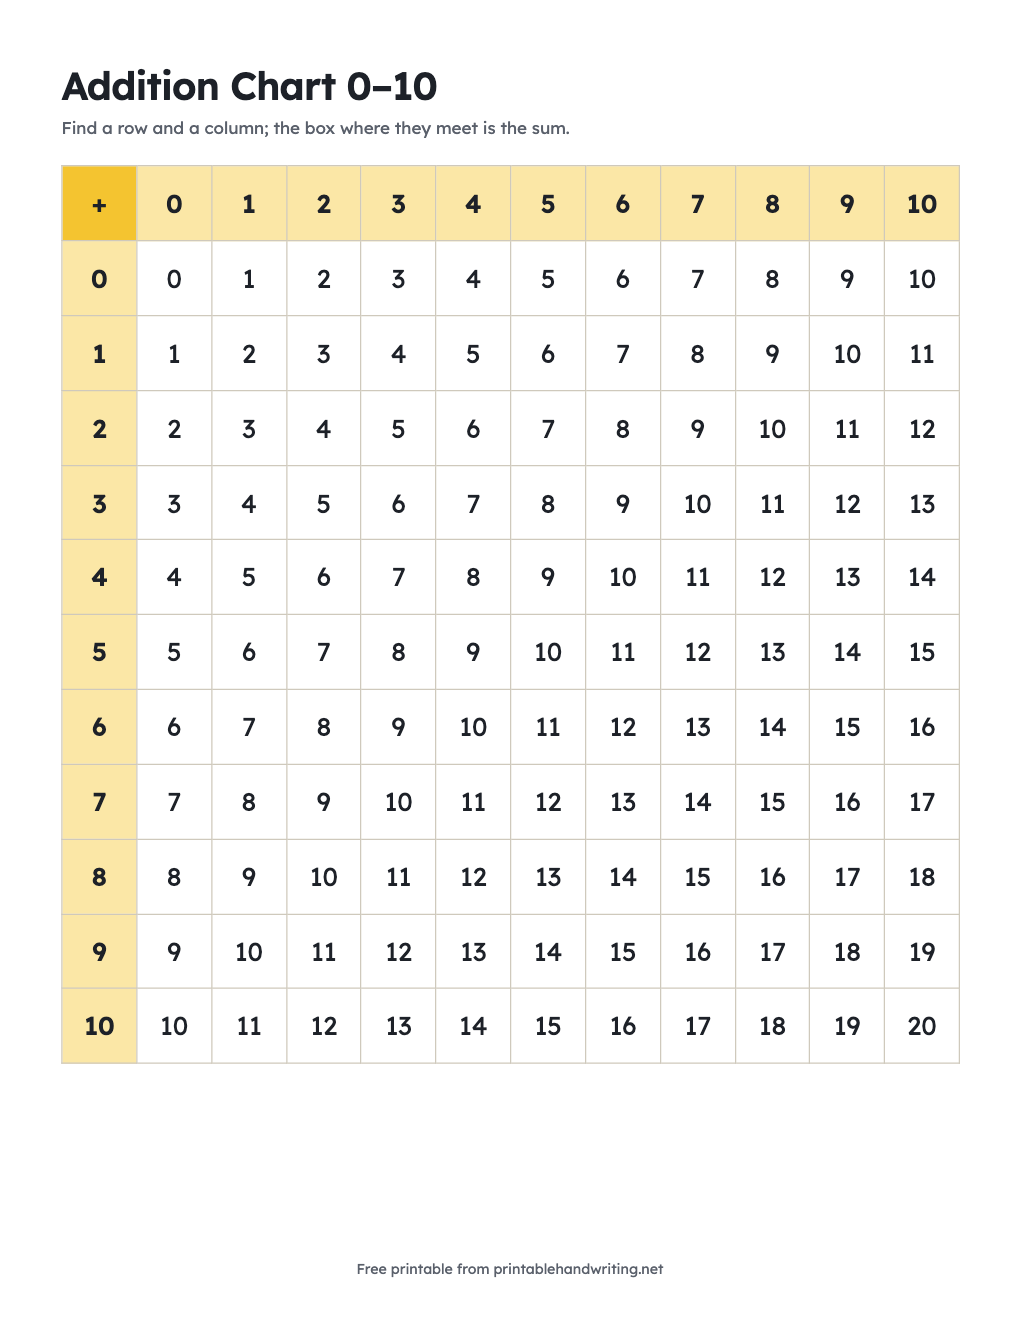
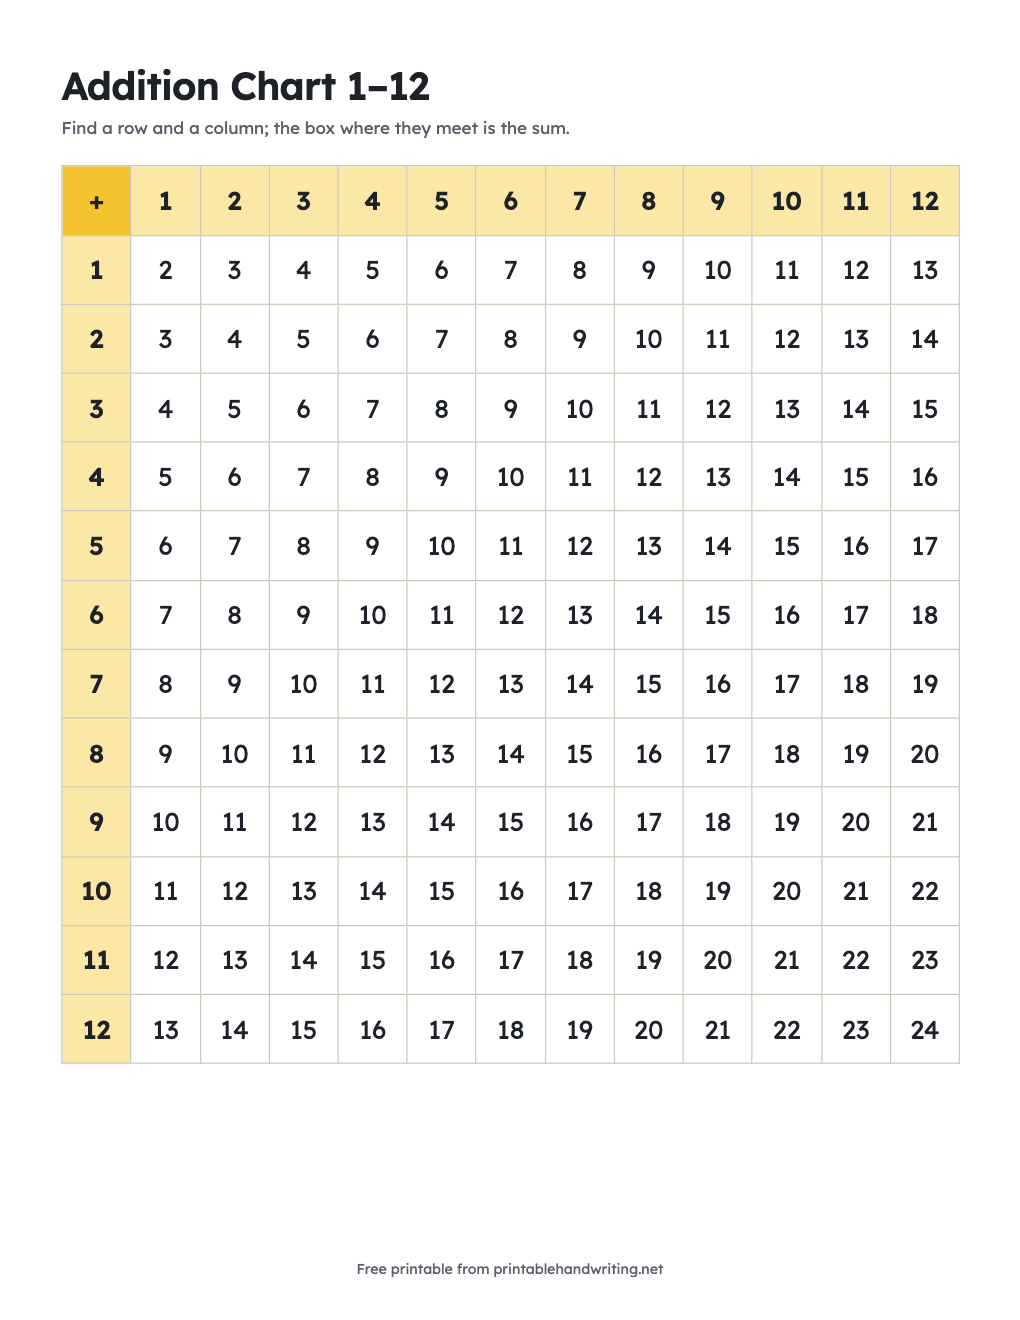
An addition chart shows the sum of two numbers in a grid: find one addend along the top, the other down the side, and the box where they meet is the sum. The chart below covers every fact from 0 + 0 to 10 + 10, the basic addition facts children learn from kindergarten to second grade. Printable 0–10 and 1–12 charts and a blank chart are underneath.
6 + 7 = 13
Point at or tap any box to see its fact.
| + | 0 | 1 | 2 | 3 | 4 | 5 | 6 | 7 | 8 | 9 | 10 |
|---|---|---|---|---|---|---|---|---|---|---|---|
| 0 | 0 | 1 | 2 | 3 | 4 | 5 | 6 | 7 | 8 | 9 | 10 |
| 1 | 1 | 2 | 3 | 4 | 5 | 6 | 7 | 8 | 9 | 10 | 11 |
| 2 | 2 | 3 | 4 | 5 | 6 | 7 | 8 | 9 | 10 | 11 | 12 |
| 3 | 3 | 4 | 5 | 6 | 7 | 8 | 9 | 10 | 11 | 12 | 13 |
| 4 | 4 | 5 | 6 | 7 | 8 | 9 | 10 | 11 | 12 | 13 | 14 |
| 5 | 5 | 6 | 7 | 8 | 9 | 10 | 11 | 12 | 13 | 14 | 15 |
| 6 | 6 | 7 | 8 | 9 | 10 | 11 | 12 | 13 | 14 | 15 | 16 |
| 7 | 7 | 8 | 9 | 10 | 11 | 12 | 13 | 14 | 15 | 16 | 17 |
| 8 | 8 | 9 | 10 | 11 | 12 | 13 | 14 | 15 | 16 | 17 | 18 |
| 9 | 9 | 10 | 11 | 12 | 13 | 14 | 15 | 16 | 17 | 18 | 19 |
| 10 | 10 | 11 | 12 | 13 | 14 | 15 | 16 | 17 | 18 | 19 | 20 |
How to read an addition chart
- Find the first addend in the left column, for example 6.
- Find the second addend in the top row, for example 7.
- Follow the row across and the column down until they meet.
- The number in that box is the sum: 6 + 7 = 13.
Patterns to notice
- The 0 row and column repeat the other number: adding 0 changes nothing.
- The diagonal from the top left holds the doubles: 0, 2, 4, 6, up to 20.
- Every diagonal running the other way has the same sum in each box, which shows all the ways to make that number.
- The chart is symmetric: 3 + 8 and 8 + 3 land on the same sum.
Using the chart for subtraction
Subtraction is the same chart read backwards. For 13 − 6, go to the 6 row, move across until you reach 13, and read the number at the top of that column: 7. Seeing addition and subtraction on one grid makes fact families such as 6 + 7, 7 + 6, 13 − 6, and 13 − 7 easy to spot.
The Common Core standards expect students to know from memory all sums of two one-digit numbers by the end of grade 2, which is exactly the 0–9 part of this chart.
Questions
- Is the addition chart free to print?
- Yes. Every chart on this page is a free PDF in US Letter or A4, with no account and no watermark. Print it at 100% (actual size) so the grid fits the page.
- How many facts are on a 0–10 addition chart?
- There are 121 boxes, from 0 + 0 to 10 + 10. Because 3 + 8 and 8 + 3 are the same fact, there are 66 different facts.
- What is a blank addition chart for?
- Students fill in each sum themselves. Start with the 0s, 1s, 10s, and doubles, then use the symmetry to fill the mirror image; the empty boxes that remain are the facts to practice.