Multiplication chart
Multiplication Chart 1–12
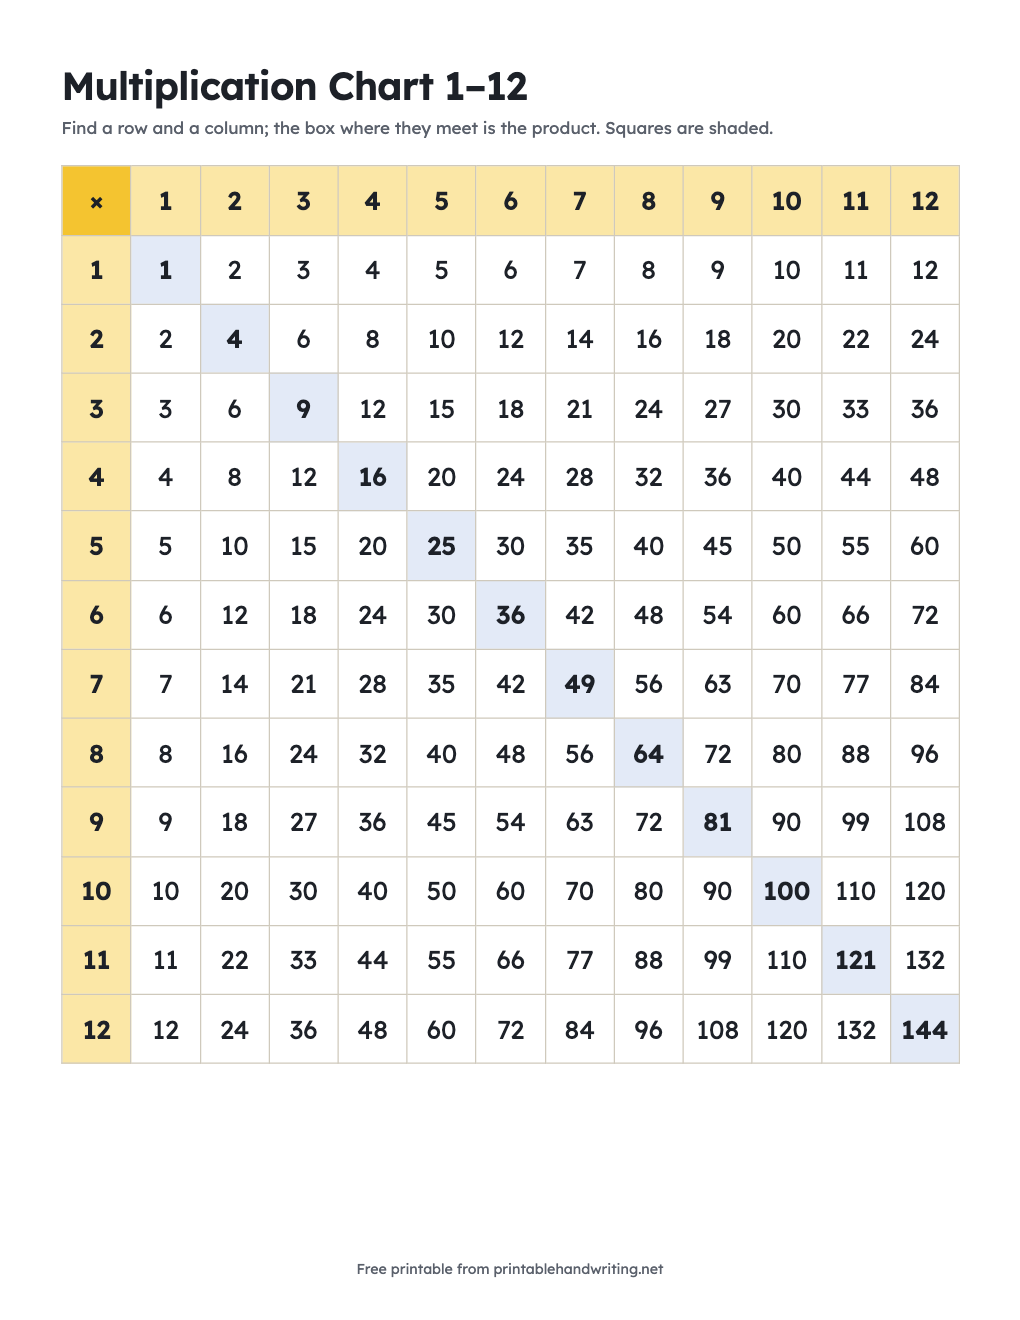
A multiplication chart lists the products of two numbers in a grid: find one factor along the top, the other down the side, and the box where the row and column meet is the answer. The chart below covers 1 × 1 to 12 × 12. Free printable versions for 1–10, 1–12, and 1–20, plus a blank chart to fill in, are underneath.
7 × 8 = 56
Point at or tap any box to see its fact.
| × | 1 | 2 | 3 | 4 | 5 | 6 | 7 | 8 | 9 | 10 | 11 | 12 |
|---|---|---|---|---|---|---|---|---|---|---|---|---|
| 1 | 1 | 2 | 3 | 4 | 5 | 6 | 7 | 8 | 9 | 10 | 11 | 12 |
| 2 | 2 | 4 | 6 | 8 | 10 | 12 | 14 | 16 | 18 | 20 | 22 | 24 |
| 3 | 3 | 6 | 9 | 12 | 15 | 18 | 21 | 24 | 27 | 30 | 33 | 36 |
| 4 | 4 | 8 | 12 | 16 | 20 | 24 | 28 | 32 | 36 | 40 | 44 | 48 |
| 5 | 5 | 10 | 15 | 20 | 25 | 30 | 35 | 40 | 45 | 50 | 55 | 60 |
| 6 | 6 | 12 | 18 | 24 | 30 | 36 | 42 | 48 | 54 | 60 | 66 | 72 |
| 7 | 7 | 14 | 21 | 28 | 35 | 42 | 49 | 56 | 63 | 70 | 77 | 84 |
| 8 | 8 | 16 | 24 | 32 | 40 | 48 | 56 | 64 | 72 | 80 | 88 | 96 |
| 9 | 9 | 18 | 27 | 36 | 45 | 54 | 63 | 72 | 81 | 90 | 99 | 108 |
| 10 | 10 | 20 | 30 | 40 | 50 | 60 | 70 | 80 | 90 | 100 | 110 | 120 |
| 11 | 11 | 22 | 33 | 44 | 55 | 66 | 77 | 88 | 99 | 110 | 121 | 132 |
| 12 | 12 | 24 | 36 | 48 | 60 | 72 | 84 | 96 | 108 | 120 | 132 | 144 |
How to read a multiplication chart
- Find the first factor in the left column, for example 7.
- Find the second factor in the top row, for example 8.
- Follow the row across and the column down until they meet.
- The number in that box is the product: 7 × 8 = 56.
Patterns to notice
- The chart is symmetric across its diagonal: 3 × 8 and 8 × 3 give the same product. A 12 × 12 chart has 144 boxes but only 78 different facts.
- The shaded diagonal holds the square numbers: 1, 4, 9, 16, 25, and so on up to 144.
- Every product in the 5s row ends in 0 or 5, and every product in the 10s row ends in 0.
- From 9 × 1 to 9 × 10, the digits of each product add up to 9: 18, 27, 36, 45.
- The 4s row doubles the 2s row, and the 8s row doubles the 4s row.
- From 11 × 1 to 11 × 9, the product repeats the digit: 11, 22, 33.
Which chart to print
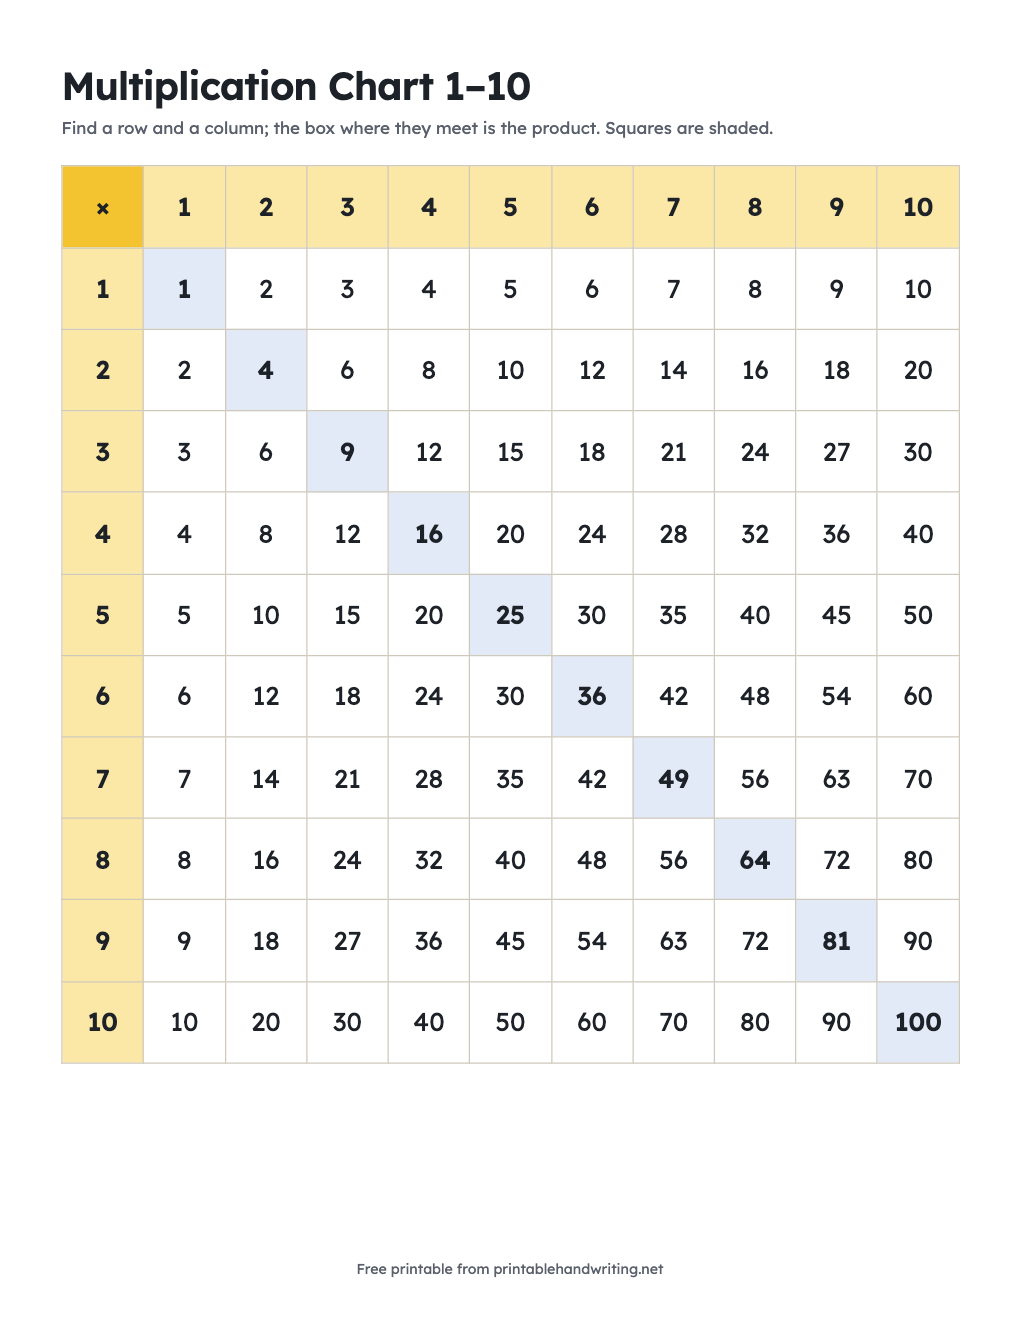
- 1–10: the facts the Common Core standards expect students to know from memory by the end of grade 3 (all products of two one-digit numbers), plus the 10s.
- 1–12: the most common classroom chart; the 11s and 12s show up in dozens, inches, and months.
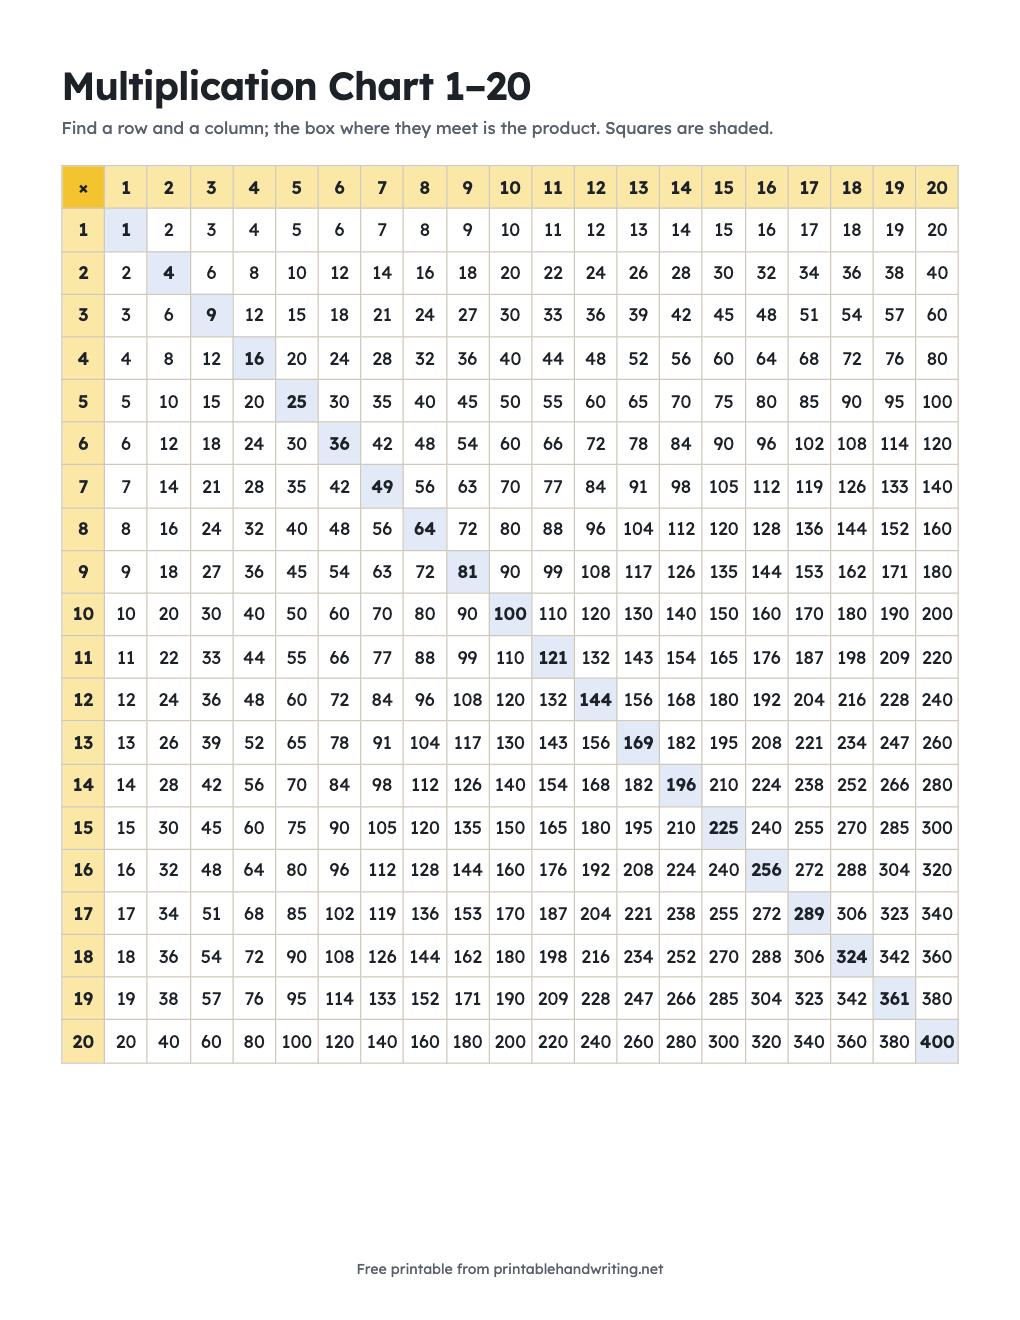
- 1–20: for older students exploring patterns, square numbers, and larger products.
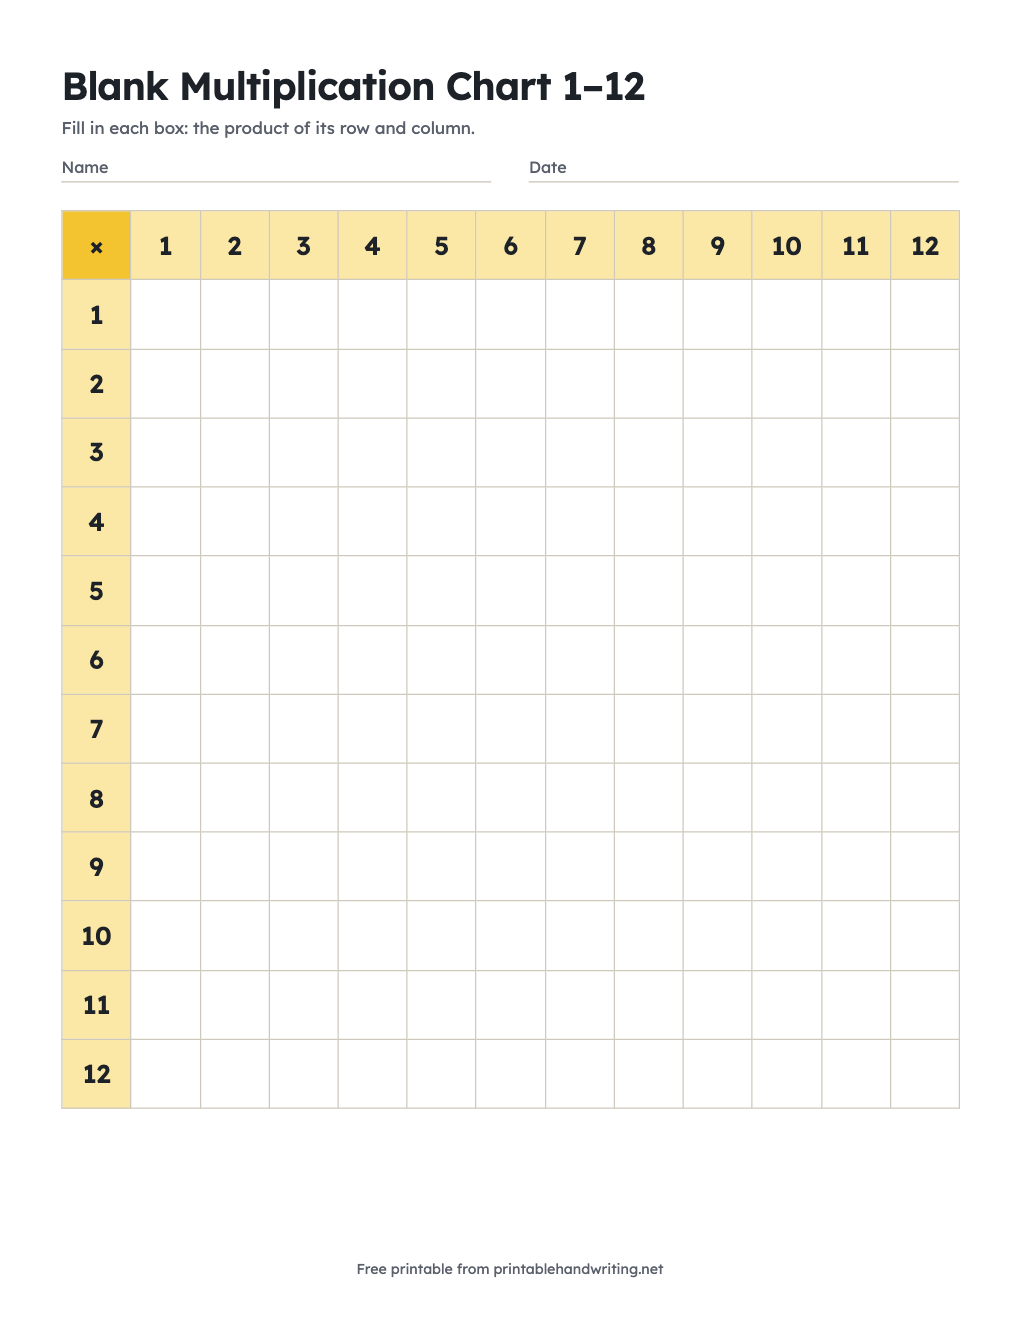
- Blank 1–12: fill in the products as practice. Start with the 1s, 2s, 5s, and 10s, then use the symmetry to fill the mirror image.
From the chart to memory
A chart is a reference while the facts are new. As each family becomes automatic, cover that row and column, or switch to the blank chart and fill in only the facts still being learned. Short daily practice with a few facts at a time works better than long drills.
Keep practicing
Multiplication facts worksheets30 mixed facts from 0 to 12 per page, with an answer key.Times tables worksheetsPractice one times table at a time, 2 to 12.How to learn the times tablesAn order for learning the facts, and how to practice them.Addition chartEvery sum from 0 + 0 to 10 + 10 in one printable grid.
Questions
- Is the multiplication chart free to print?
- Yes. Every chart on this page is a free PDF in US Letter or A4, with no account and no watermark. Print it at 100% (actual size) so the grid fits the page.
- What is the difference between a multiplication chart and a times table?
- They hold the same facts. A times table lists one number’s facts in a column (7 × 1 = 7, 7 × 2 = 14, and so on), while a multiplication chart puts every table in one grid.
- How many facts are on a 12 × 12 multiplication chart?
- There are 144 boxes, but because 3 × 8 and 8 × 3 are the same fact, there are only 78 different facts to learn.
- What is the best way to use a blank multiplication chart?
- Fill in the easiest rows first (1s, 2s, 5s, 10s), then the squares on the diagonal, then mirror each filled box across the diagonal. Whatever is left is the short list of facts to practice.